Summary
The rising demand for grid connections requires urgent optimization of energy transmission, with Terna, as the transmission system operator, addressing these challenges. However, building new power lines in Italy is complex due to its diverse terrain—mountains, plains, hills, volcanoes, rivers, lakes, and a rugged coastline—along with numerous environmental, landscape, and geological constraints that slow project implementation.
To streamline processes, Terna employs advanced data collection systems and specialized software to integrate environmental data from the earliest feasibility stages. Traditionally, planners defined overhead line routes based on technical feasibility, assessing environmental impact only later. The new methodology enables pre-validated corridors and routes from both environmental and landscape perspectives, improving efficiency and reducing approval times.
These applications have been extended to various projects, delivering valuable results within shorter timelines. A key example is the integration of detailed archaeological data and zoning regulations protecting large areas, using a weighted system. This approach helps address constraints early, minimizing revisions and accelerating project definition.
1 Introduction
In response to the growing energy demand and the integration of renewable sources into the power grid, Terna faces the challenge of optimizing the transmission of renewable energy across the national territory. This objective is hindered by the difficulty of rapidly constructing new power lines due to the increasing number of connection requests and the diverse characteristics of the Italian landscape.
One solution to this challenge is the use of high-voltage direct current (HVDC) transmission lines, which enable the transfer of renewable energy from southern to northern Italy with a lower environmental impact compared to traditional alternating current (AC) lines. However, the adoption of this technology requires a detailed territorial analysis from the early design stages to identify the most suitable solutions based on local environmental, social, and regulatory constraints. The surge in connection requests is driven by the rapid expansion of renewable energy sources, with southern Italy serving as the primary production area for wind and solar energy, while northern Italy has a higher energy demand. However, the country’s complex geography poses significant challenges to the development of new power lines due to environmental, landscape, and accessibility constraints.
This paper highlights how Terna has optimized analysis timelines and processes through the use of software that integrates environmental data, supporting the design team in the early planning stages. The early integration of environmental and landscape analyses has led to the development of solutions that streamline and optimize the process, reducing the need for revisions and accelerating approval times. Furthermore, the use of advanced software to incorporate environmental data during the feasibility phase has expedited the design process, optimizing routing based on morphological and environmental constraints. Thanks to these solutions, Terna is successfully addressing the increasing demand for renewable energy, maximizing the use of available resources while maintaining project delivery timelines.
2 Territorial analyses
In the context of territorial analyses at Terna, the primary objective is to identify optimal locations for new infrastructure projects, considering factors such as environmental constraints, territorial planning, existing infrastructure, and the presence of residential areas. This process is complex and time-consuming, requiring the collection and analysis of extensive data. To address these challenges, advanced Geographic Information Systems (GIS) and digital cartography are employed.
In the past, the design of overhead power lines did not prioritize environmental considerations, favouring more linear routes. Today, the presence of numerous constraints has made the planning process more intricate, with the goal of protecting environmentally sensitive areas. GIS tools enable the acquisition, analysis, and visualization of geographic data from various sources, such as topographic surveys and environmental constraints, supporting more sustainable and strategic decision-making.
Digital cartography and the georeferencing of official maps allow for a precise representation of the territory, facilitating the analysis of spatial variables and the simulation of urban
development scenarios. This way, a parallel view of reality is obtained directly on the desktop, in line with the ‘twin transition’, enhancing the synergy between the technological-digital transition and the environmental one.
These tools are essential for assessing the environmental impact of new infrastructure and for efficiently planning development projects. The integration of GIS and advanced digital mapping enables informed, environmentally conscious decision-making, fostering a balanced and sustainable infrastructure development approach.
2.1 Territorial planning in Italy
To support territorial analyses, it is essential to use open data available through official channels of various territorial authorities, such as the District Basin Authorities (DBA). These entities are responsible for planning and managing the hydrographic basin as a unified system through the Basin Plan [1]. A key aspect of our analyses involves consulting sectoral planning documents, particularly the Regional Landscape Plans (RLP).
In Italy, Regional Landscape Plans are fundamental tools for landscape protection and enhancement, yet their development and implementation vary significantly across regions. This heterogeneity is evident in several aspects:
- Structure and Content: Each region adopts a different approach in drafting its landscape plan.
- Approval Procedures: Timelines and approval processes differ among regions. Some have finalized and approved their plans, while others are still in the drafting or updating phase, reflecting different priorities and resources.
- Consultation Tools: The availability and accessibility of RLSs vary. Some regions provide their plans through a GIS-Web system accessible via the regional geoportal, while others only offer PDF maps at scales too broad to capture specific landscape features, limiting their usability for our analyses.
These discrepancies complicate the harmonization of landscape policies at the national level, as each region develops its plan based on specific territorial needs, local regulations, and available resources. As a result, dealing with a multitude of regulations and planning tools increases the complexity of landscape management and protection in Italy.
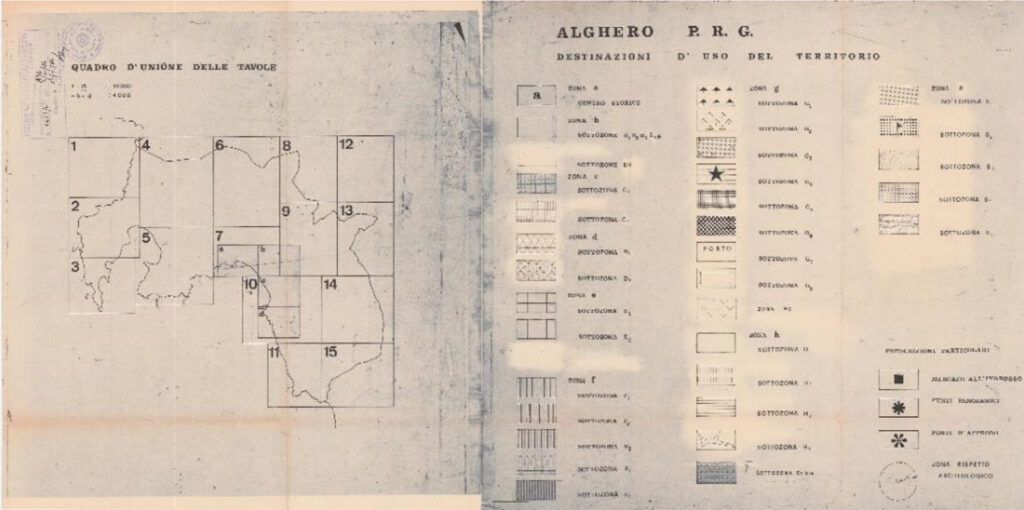
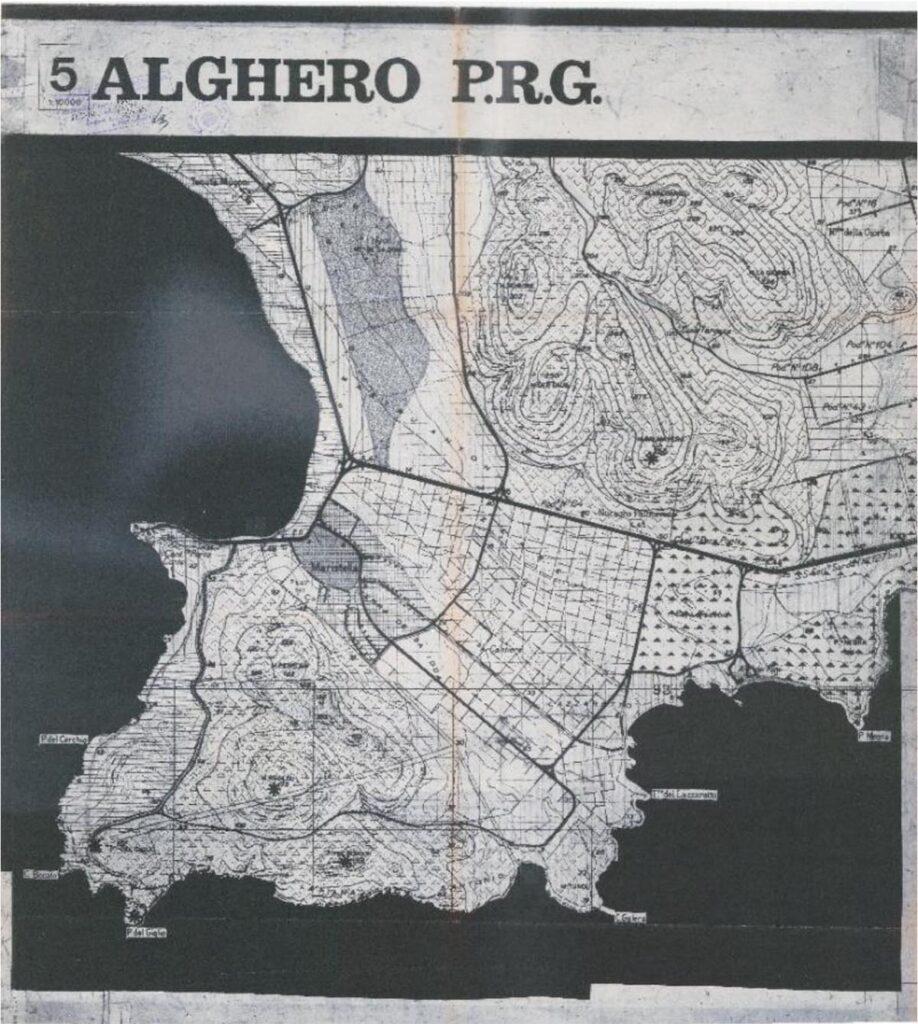
A particularly challenging aspect of municipal urban planning concerns the use of scanned documents from decades-old records. Georeferencing these files is highly difficult, as they do not account for modifications introduced by subsequent urban planning amendments. Consequently, in addition to featuring hard-to-decipher legends, these documents often prove outdated compared to the current territorial situation.
The following example illustrates this issue: the first image shows the Union Framework of the Tables of the General Regulatory Plan, G. R. P. . of the Municipality of Alghero [2], including its legend. The second image displays one of the detailed maps (specifically, sheet no. 5), demonstrating how these documents are currently available and the challenges in associating a legend with such a cartographic representation.
2.2 The Terna Cartographic Database
The complexity in analysing the data needed for territorial assessments derives from their multiplicity, diversity, and sometimes, difficult accessibility. Terna uses these data as fundamental informative layers to support the activities of designing and implementing new projects, as well as for the maintenance of the National Transmission Grid (NTG).
To optimize and speed up the action of sourcing during the pre-feasibility phases, Terna has equipped itself with a cartographic database of the Italian territory, which is user-friendly and continuously updated.
Within the database, data produced and managed by various entities (Ministries, Regions, Basin Authorities, etc.) obtained over the years in the framework of the Strategic Environmental Assessment of Terna’s Development Plan are converged. However, the data are continuously updated and therefore, once obtained, need to be verified over time.
The Territorial Analysis and GIS team is responsible for updating the data within the databases; in recent years, this has shifted from an annual to a quarterly update. The consultation of updated data is essential to consult updated and current cartography and regulations.
Users accessing the database can do so easily through a cartographic portal where various consultation services of different types are published, accessible from different software (Google Earth Pro, GIS, CAD). Having data accessibility directly within the software and knowing that there is constant updating behind the publication allows users to carry out analyses and considerations of the investigated area quickly.
Currently, the corporate portal publishes 48 services GIS [3] containing around 2400 cartographic layers dedicated to constraints and protected areas on the Italian territory, divided either by the scale of the source (national, regional, provincial) or by theme (Areas with hydro geomorphological hazard, polluted sites, etc.); this indicates that to analyse a specific area, it is necessary to load different services based on the type of analysis.
These data do not offer a detailed view of all the cartography of a study area but provide the possibility of conducting an initial screening useful for guiding design choices already in the early stages of project alternative development and to prepare the desktop study for the project.
Once the alternatives are identified or less critical or more suitable areas for interventions are defined, a documentary report is drawn up that includes detailed cartography (municipal planning).
2.3 Localization of Projects
Once the new connection needs of Terna’s Development Plan or the connection needs of third- party users are defined, the designers request the support of territorial analyses, which specifically deal with identifying different localization alternatives for the new intervention in the area of interest, considering the following elements:
- Environmental constraints;
- Areas with hydro morphological hazard;
- Presence of roads useful for the passage of machinery;
- Proximity to the existing Transmission Grid;
- Land slopes below 3%;
- Presence of disused or abandoned industrial areas;
- Presence of degraded areas;
- Urbanized context (both continuous and discontinuous);
- Any other element of interest for the purpose of localization.
All these elements, and not only, contribute to the characterization of the investigated area, to identify the most suitable detailed sites to accommodate various types of works: new electrical substations (ES), new overhead power lines, new underground cables.
For each type of intervention, the competing elements may have different relevance. For example, in the case of new ESs, it is important to identify areas with high or very high landslide hazard to avoid interference or, in some cases, to secure the surrounding territory. For linear infrastructures and particularly for overhead power lines, the focus is mainly on the impact these can have on the landscape. Therefore, the cartographies of Landscape Plans at the national, regional, and provincial levels are investigated and inserted into a GIS (Geographic Information System) to take them into account simultaneously and identify a “corridor,” which is a narrower passage within the investigation area where the number and type of constraints are minimized; in this way, an attempt is made, as far as possible, to design a new intervention in the most environmentally sustainable manner.
However, when an area is vast, it is necessary to simultaneously consider all the elements present within it, with an overall view that considers territorial complexities at the same time. For this purpose, an “environmental cost” map is generated, detailed in the following paragraph.
2.4 Environmental Cost
Starting from the concept that data is the most important element for desktop environmental analyses, to give an idea of the quantity of elements that can overlap in an area, below is a representative image where it is possible to appreciate the number of elements present in a random portion of the Lombardy territory, a region in Italy [4].
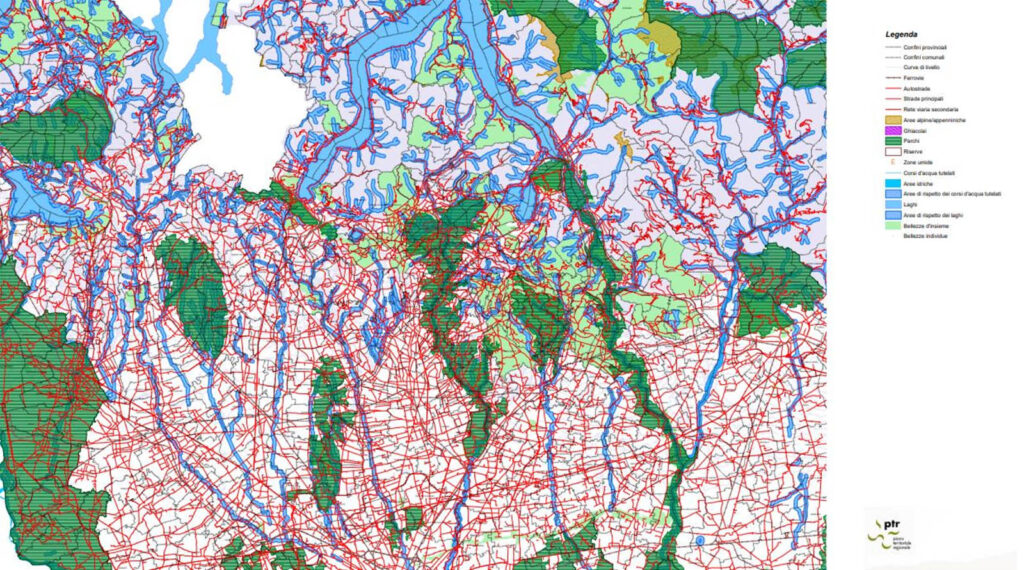
Each element is associated with sector-specific technical implementation regulations that provide guidelines for the realization of our works.
Searching for, identifying, and analysing all elements of interest takes a lot of time, and projects often operate under urgency; it is not always easy to conduct detailed analyses for preliminary design phases. Over the years, a method had to be developed to consider all the interfering elements at a single point: the more elements overlap at one point, the more complex the analysis and the so-called “environmental weight” become.
On this principle, Terna has developed a semi-automatic methodology through a GIS procedure that, considering all elements simultaneously, generates an environmental cost map.
The choice of a semi-automatic approach allows for the application of procedures and criteria shared at the national strategic environmental assessment (SEA) Table level, while leaving room for discretion and adaptability to the context, making the mechanism for generating alternatives more flexible. However, fully automatic procedures are not used, as various phases require careful control of hypotheses and parameters used, to verify in the field, through joint inspections with the competent Territorial Administrations, that significant aspects of the territory under examination have not been overlooked.
The environmental cost map or resistance map is generated by discretizing the territory into regular cells through a grid (from vector representation to raster representation). Each cell is assigned an environmental crossing cost by a new overhead line, based on the constraints overlapping it. Exclusion cells, where the constraints are obstructive to the Project work, are considered not admissible.
Each constraint is assigned a value based on its level of protection. The costs thus obtained are then used to value each cell, assigning it a score.
It is evident that this method also requires some subjective choices, which must be exhaustively motivated and documented, to make the analyses easily retraceable and achieve a shared result.
The value of a cell depends on the following factors:
- The number of cartographic layers of different nature that have the same level of protection
- The cumulative effects determined by the presence of multiple factors
The more environmental constraints overlap, the higher the environmental cost.
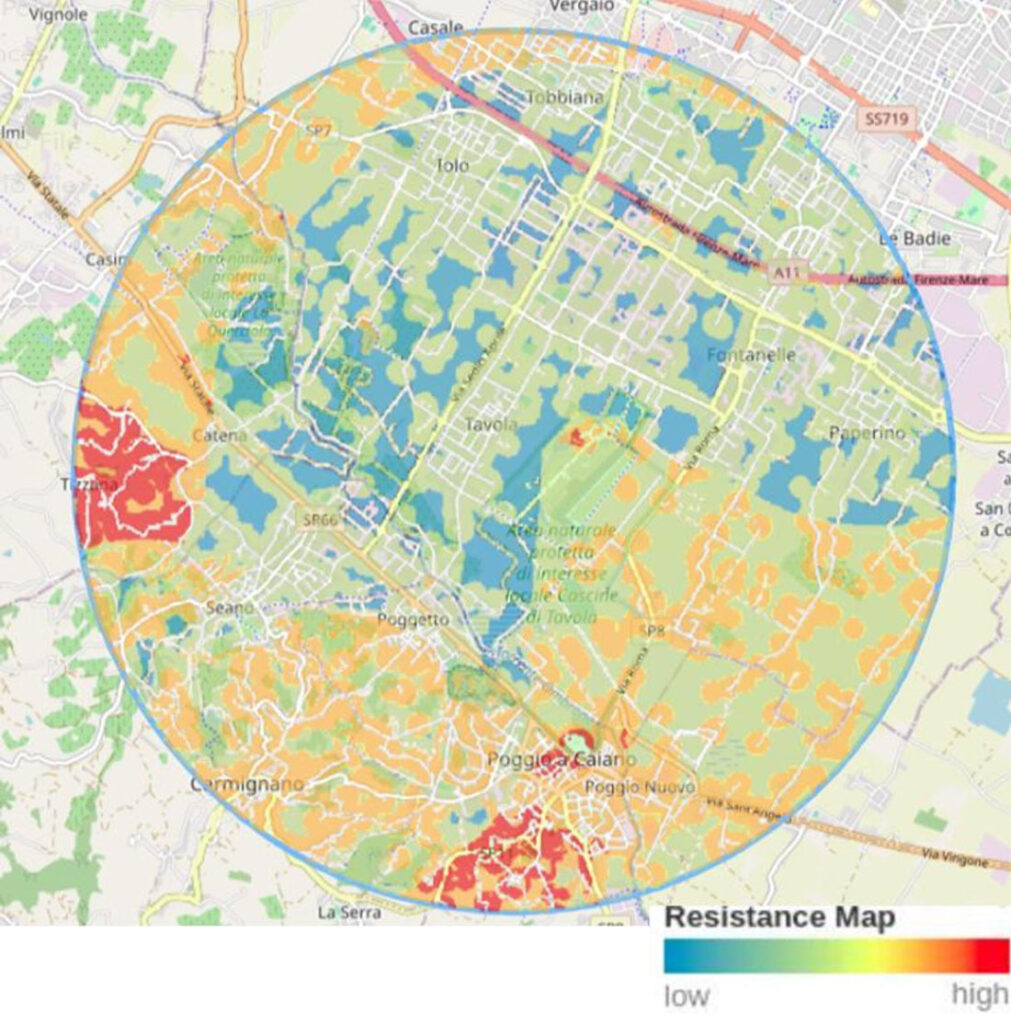
Each additional overlap, regardless of the criterion, produces an increase (set at 50%) compared to the next position. Conversely, the attractive values for locations assume negative values, thereby lowering the resulting environmental cost. The resistance or environmental cost maps are used as a basis for identifying areas with lower/higher environmental cost. Below is a graphical representation where the red areas have higher resistance, and the blue areas have lower resistance.
2.5 Pathfinder Software
The teams that collaborate to identify the best areas for the localization of new interventions are mainly two: the design area team and the territorial analysis team. Each team works in a different storage space and uses tools that do not always communicate smoothly with each other. Below is a representative image of the current workflow.
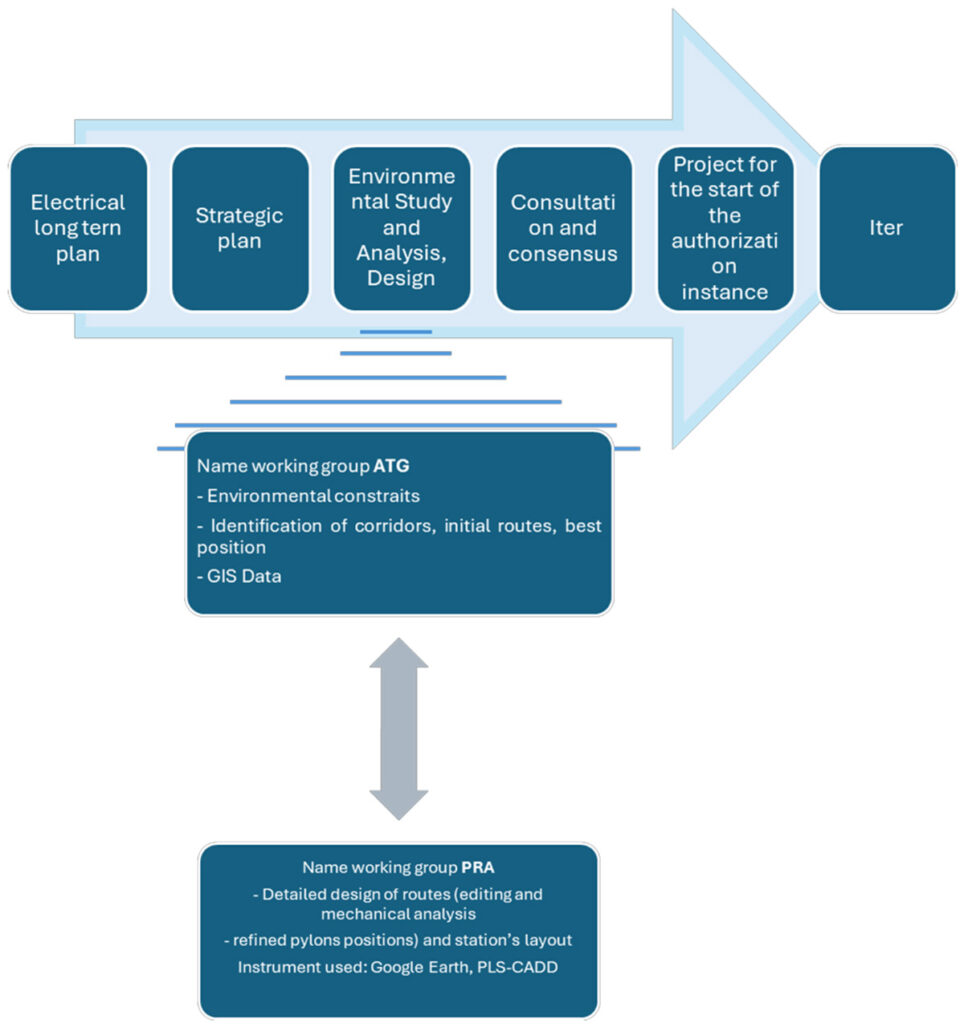
The problem, therefore, is the transfer of data and information derived from analyses from one team to another.
Terna has equipped itself with software called Pathfinder, capable of considering all elements published in the cartographic database as input data and processing them according to the methodology agreed upon within the Strategic Environmental Assessment (SEA). Pathfinder is a cloud application [5], used for planning and routing linear infrastructures such as power lines, underground cables, pipelines, roads, railways, as well as for the optimal positioning of location-dependent structures. Within a single interface, the tool allows us to generate resistance maps in accordance with the methodology used within the SEA, environmental corridors, and alternative routes for the development of overhead power lines. Additionally, the tool allows us to identify areas with lower environmental costs for the localization of point
elements, in our case for new substations, always considering all technical and environmental parameters.
Thanks to the collaboration between Terna and the developers of Pathfinder, we were able to implement the software in a way that generates more realistic results, closer to those achieved by design without the software, while also considering technical and environmental aspects. The developments have covered various areas:
- Post-processing tools;
- Possibility of editing tracks directly in the web application;
- Implementation of input data (presence of continuous and scattered urbanization, areas for future expansion of renewable resources, archaeological data from bibliography).
In addition, the development of customized user profiles based on each user’s role in the design process has been proposed to ensure uniform use of the tool and information sharing. Currently, this functionality is still under development, but the proposal has been accepted, and we are collaborating with the developers to finalize it.
2.6 Conclusions and a Look to the Future
The use of a single integrated tool, with a single storage space dedicated to design and pre- feasibility analyses, makes the process more fluid and immediate, avoiding the dispersion of information.
We will commit to collaborating with developers to implement all necessary improvements so that designers can achieve the most realistic and project-oriented results through the application.
The future goal will be to compare the timing of traditional procedures with those obtained using the software, to estimate the reduction in time and the consequent improvement of the entire process. Specifically, we will conduct a comparative time analysis between a project authorized without the support of the software and one that has benefited from its use. This comparison will allow us to verify any time reductions, general process improvements (e.g., fewer revisions), and the achievement of objectives even with challenging timelines.
Bibliography
- M.d.e.d.s.e. (M.A.S.E.), “Autoritàdibacinodistrettuali,” 2025. [Online]. Available: https://www.mase.gov.it/pagina/autorita-di-bacino-distrettuali.
- C. d. Alghero,“PianoRegolatoreGenerale-P.R.G.,” 1984. [Online]. Available: https://urbanistica.comune.alghero.ss.it/pianificazione- urbanistica/copy5_of_piano-urbanistico-comunale-puc.
- ESRI, “Spatial analysis in ArcGIS Pro,” [Online]. Available: https://pro.a3rcgis.com/en/pro- app/latest/help/analysis/introduction/spatial-analysis-in-arcgis-pro.htm.
- R. Lombardia, “Piano paesaggistico regionale,” 2024. [Online]. Available: https://www.regione.lombardia.it/wps/portal/istituzionale/HP/Detta glioRedazionale/servizi-e-informazioni/Enti-e- Operatori/territorio/paesaggio/piano-paesaggistico-regionale/piano- paesaggistico-regionale.
- Gilytics AG, “Gilytics AG,” [Online]. Available: https://gilytics.com/.